← Elevate Aura  ·  Aura Business, the operations platform Chennai, India · WhatsApp
For service heads reviewing the month

The service numbers that tell you where the week went.

Aura Business reports on the service operation from the records the desk and the engineers already create: how many calls came in, how long they stayed open, who closed them, what spares they consumed and which contracts are worth keeping.

Call volume and open-call ageingEngineer utilisation and SLA breachesContract profitability, not just revenue
app.elevateaura.co.in/analytics
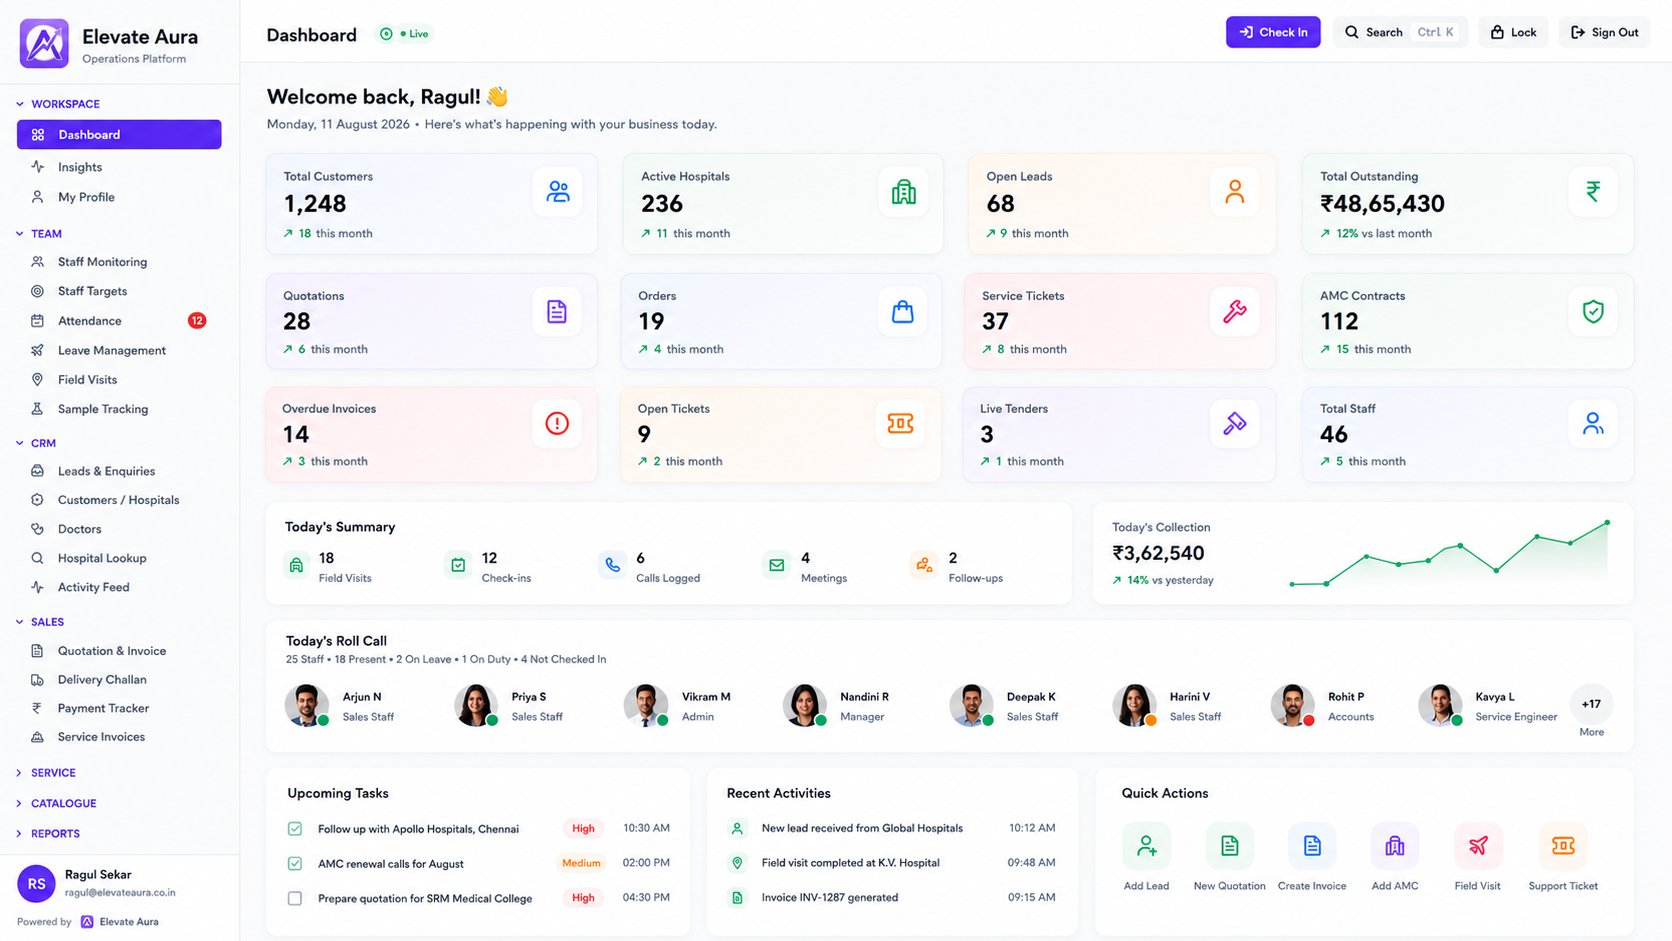
Aura Business owner dashboard showing service call volume, open calls by age, engineer load and contract revenue
In one sentence

Analytics that come out of the work, not out of a form

Service reporting fails in most companies for one reason: the numbers are compiled separately from the work. Someone asks the desk for a call count, the desk types a sheet, and by the time it is ready it describes a month that has already gone.

In Aura Business the reporting is a by-product. The call was logged at intake, the engineer was dispatched from the desk, the job card was closed on the phone with spares recorded, the SLA timer ran on its own, and the invoice came from the closed job. Every figure a service head wants is already in those records.

What follows is the set of questions a service operation should be able to answer at any moment, and where each answer comes from. Nothing here is a benchmark or an industry claim; the figures are yours, drawn from your own calls.
The questions that go unanswered

Six things a service head is usually asked and cannot prove.

Not knowing is manageable. Not being able to find out is what makes the month a guess.

How many calls are open right now

The desk counts by scrolling a chat history, and the count changes depending on who does it.

How old is the oldest one

A call that has been open for three weeks is invisible until the customer escalates it.

Are we fixing things on the first visit

Repeat visits to the same asset for the same fault are never counted, so the pattern is never noticed.

Is the team busy or overloaded

Jobs per engineer per day is not recorded, so headcount decisions are made on the loudest complaint.

Where did the spares go

Parts leave stock without being booked to a job, so consumption cannot be traced to work done.

Which contracts are worth renewing

Contract revenue is known, the cost of serving each contract is not, so renewals are priced on last year's figure.

How a number is made

From one service call to the month's picture.

01

Intake records the call

Customer, asset, fault and contract status captured when the call is logged, with the SLA clock started.

→
02

Dispatch records the engineer

Assignment by skill and area gives every job a named owner and a time it was allocated.

→
03

The job card records the work

Fault found, work done, spares consumed and the customer's signature, captured on site.

→
04

Closure stops the clock

Resolution time and any SLA breach are recorded against the call without anyone calculating them.

→
05

Stock and billing update

Spares drop from inventory against the job, and chargeable work becomes a service invoice.

→
06

The dashboard adds it up

Volume, ageing, utilisation, consumption and contract performance are read from those same records.

What you can read

The service views, and where each one comes from.

📞Demand and backlog

  • Calls logged by period, customer and asset
  • Open calls by age, oldest first
  • Ticket status workflow across the queue
  • Breakdown calls against preventive visits

⏱Promises kept

  • SLA definitions and breach tracking
  • Response and resolution against the contract terms
  • CSAT and feedback captured on close
  • Repeat visits to the same asset, seen in service history

🛠The team

  • Jobs closed per engineer over a period
  • Technician route and schedule load
  • Attendance and field tracking alongside job counts
  • Skill-based allocation and who is qualified on what

💰Money

  • Spare parts consumed per job and per contract
  • AMC revenue and leakage dashboard
  • Contract profitability against cost of service
  • Receivables ageing on service invoices

See all 87 modules across 12 suites →

In practice

Decisions the numbers actually change.

A hiring decision stops being a feeling

Workflow: Calls logged per month are read next to jobs closed per engineer and the age of the open queue.

Result: The case for another engineer is made from the backlog, not the argument.

A recurring fault is caught

Workflow: Service history shows the same asset visited repeatedly for the same complaint within a short period.

Result: The root cause is investigated instead of the symptom being fixed again.

A contract is repriced at renewal

Workflow: The call count, engineer visits and spares consumed on that contract are placed beside what it billed.

Result: The renewal quote reflects the work the customer generates.

Spares purchasing follows consumption

Workflow: Parts booked to job cards over a quarter show what actually moves, by product and by fault.

Result: Reorder levels are set from consumption rather than habit.

Who it is for

People answerable for a service operation.

👤
Service heads

Running a desk, a spares store and a team of engineers.

🏢
Distributor owners

Watching whether after-sales pays for itself.

🧬
Biomedical service firms

Where contracts are the entire revenue line.

📋
Contract managers

Preparing renewals with evidence in hand.

📦
Spares and stores managers

Setting reorder levels from real consumption.

The honest comparison

Where service numbers usually come from.

 
Spreadsheets and WhatsApp
Accounting software
Enterprise ERP
Aura Business
Call volume
Counted by scrolling
Not held
Yes, once configured
From the intake record
Open-call ageing
Not visible
No
Yes
Oldest first, live on the desk
SLA performance
After a complaint
No
Configured module
Timers and breach tracking as standard
Engineer load
Impression
No
Yes
Jobs closed and route load per engineer
Spares per job
Store register
Issue notes
Yes
Booked to the job card, reducing stock
Contract profitability
Not attempted
Revenue only
Separate project
Cost of service beside contract revenue
Proof

Platforms we have actually shipped.

Questions

Service analytics, answered.

Do you report a first-time fix rate?

The platform records every visit against the asset, so repeat visits for the same fault are visible in service history and can be reviewed. Treat it as a pattern you can inspect rather than a single headline figure.

Where does engineer utilisation come from?

From jobs assigned and closed per engineer over a period, alongside route and roster load and attendance. It describes how work is distributed, not how hard anyone worked.

Can we see which contracts lose money?

Calls, visits and spares are booked against the contract, so the cost of serving it can be read next to what it bills. See contract management.

Is there a report builder, or fixed dashboards?

Both. The owner dashboard gives the standing service views, and the reports engine produces cuts by customer, engineer, asset, product line or territory. Specific report layouts are agreed during setup.

Do engineers have to fill in anything extra for this?

No. Everything comes from the job card they already complete on the phone and from the desk's dispatch record. No separate reporting form is introduced.

Can these numbers be exported?

Yes. Reports can be exported for board packs or for your accountant, and billing data can be exported to the accounting package. See Tally export.

Keep exploring

Related Aura Business software

Let's talk about your requirement.

Tell us how you work today. We will show you what the platform would look like for you, and give you a clear scope and timeline.

Founder-led · Chennai, India · Built and supported by the person who wrote it