← Elevate Aura  ·  Aura Business, the operations platform Chennai, India · WhatsApp
For owners who run the business from one screen

A medical distributor dashboard that shows the owner what needs a decision today.

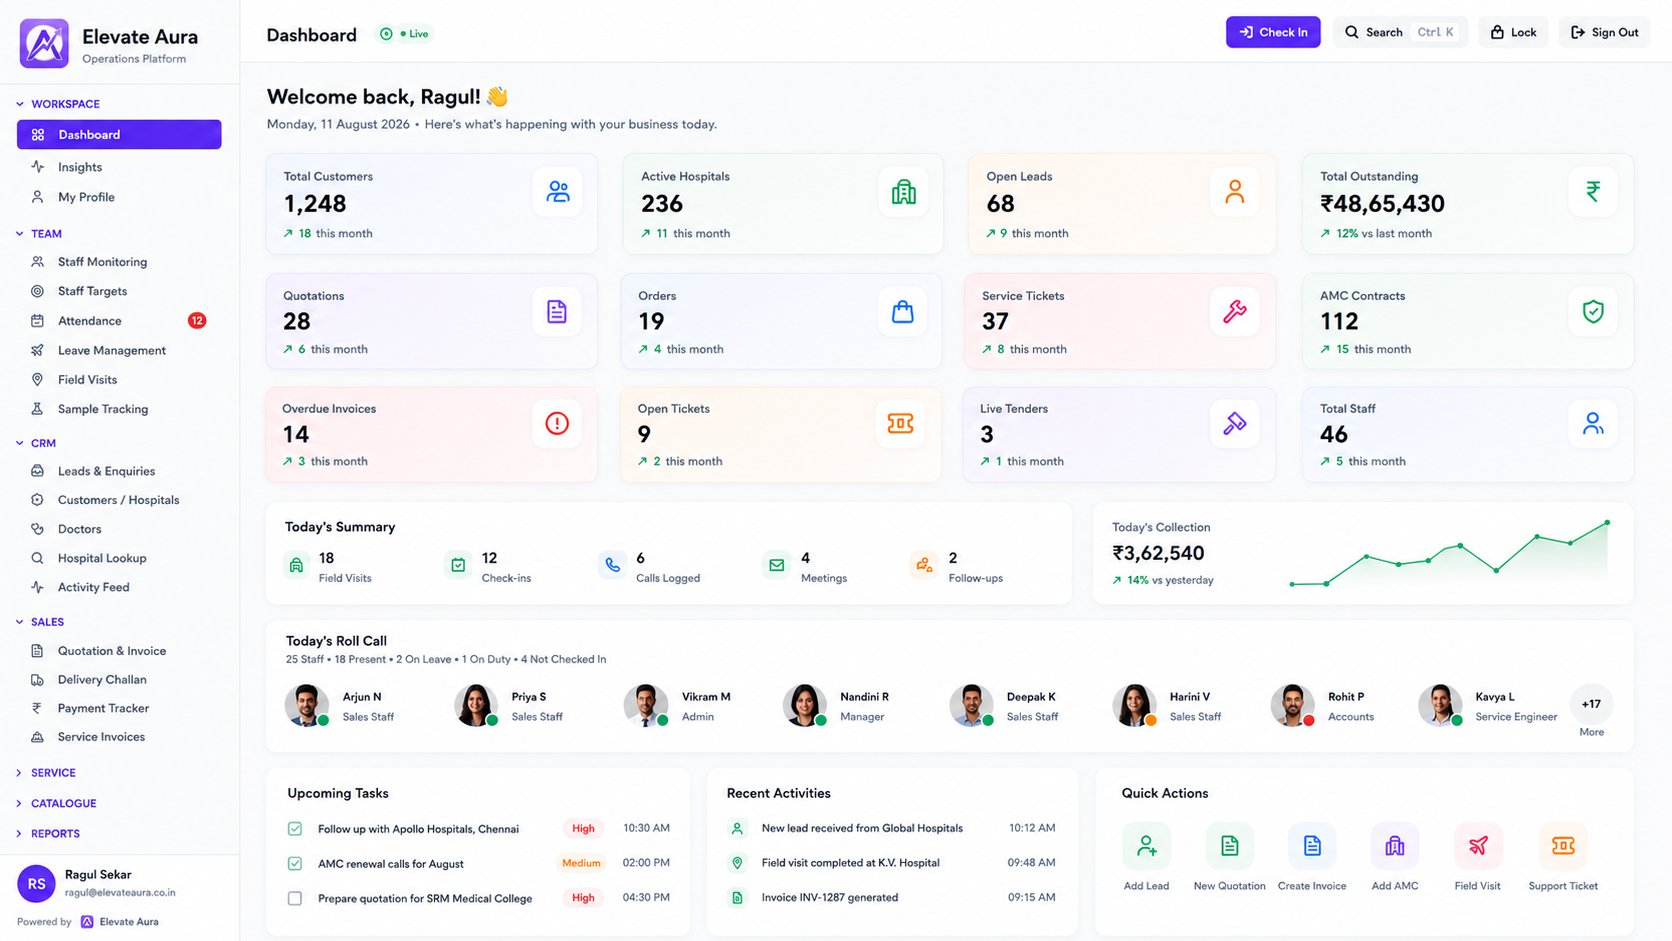
Aura Business puts pipeline, collections, AMC revenue at risk and open service calls on one owner dashboard, backs it with a reports engine, P&L by product line and territory, receivables ageing and service analytics, and sends the numbers to you rather than waiting to be opened.

Pipeline, collections, AMC, service on one screenP&L by product line and territoryReports delivered on WhatsApp
app.elevateaura.co.in/dashboard
Aura Business owner dashboard with pipeline value, outstanding collections, AMC renewals due and open service calls
In one sentence

What medical distributor analytics should show an owner

Medical distributor analytics is the set of numbers an owner needs to run sales, service and money at the same time: the pipeline and what will close this month, what is outstanding and how old it is, which AMC and CMC contracts lapse soon and what they are worth, how many service calls are open and which are breaching SLA, and which product lines and territories actually make money. Aura Business shows these on the Owner and CEO Dashboard and lets you go deeper through the reports engine.

The difference from a stitched-together report is that every number on the dashboard is the live total of transactions already in the system: quotes, invoices, receipts, contracts and job cards. Nobody prepares the dashboard. It is simply the state of the business at the moment you open it.

How owners get numbers today

Three people, two spreadsheets and a week's delay.

The sales manager has the pipeline, the accountant has the outstanding, the service head has the open calls, and the owner has a phone.

Monday numbers on Thursday

The weekly report is assembled by hand and is stale before it is read.

Outstanding without ages

The total receivable is known; which invoices are past ninety days, and with whom, is not.

AMC leakage invisible

Contracts lapse without a number attached, so the loss never appears anywhere.

Profit by product a mystery

Turnover is reported by brand; margin after spares, travel and service is not.

Service measured by complaints

Response times, repeat visits and SLA breaches are known only when a hospital escalates.

Reports nobody opens

Dashboards exist in the accounting tool, but the owner is in the field and never logs in.

How the numbers arrive

From transactions to a decision.

01

Transactions

Quotes, orders, invoices, receipts, contracts and job cards entered once by the team.

→
02

Dashboard

Owner dashboard totals them live: pipeline, collections, AMC at risk, open calls.

→
03

Drill down

Click a number to see the invoices, contracts or tickets behind it.

→
04

Reports

Reports engine for P&L by product line and territory, ageing, service and win-rate.

→
05

Delivered

Notifications hub and WhatsApp integration bring the numbers to you.

→
06

Ask

The AI assistant answers a question about the data in plain language.

What is included

The dashboard, the reports and how they reach you.

📊Owner dashboard

  • Pipeline by stage and expected close
  • Collections and outstanding
  • AMC revenue and leakage in rupees
  • Open service calls and SLA status
  • Cashflow dashboard

📈Finance reports

  • Receivables ageing by customer
  • P&L by product line and territory
  • Payables ledger
  • Expense management
  • GST returns prep

🔧Sales and service analytics

  • Lead-source and conversion analytics
  • Territory and target tracking
  • Tender outcome and win-rate analytics
  • Service history and repeat-call views
  • CSAT on ticket close

🔔Delivery and platform

  • Reports engine with saved reports
  • Notifications hub
  • WhatsApp Business integration
  • AI assistant over your data
  • Audit log and role-based access

See all 87 modules across 12 suites →

In practice

Four decisions the dashboard makes easier.

Which customer to call about money

Workflow: Receivables ageing shows two hospital groups with invoices past ninety days; the owner calls those two, not the whole list.

Result: Collection effort goes where the risk is.

Which contracts to save this month

Workflow: The AMC at-risk tile shows contracts lapsing in thirty days with their rupee value; the owner reviews the top five with the service head.

Result: Renewal revenue is protected before it becomes leakage.

Which product line to push

Workflow: P&L by product line shows the high-turnover brand has the lowest margin after service cost, and a quieter line has the highest.

Result: Sales targets change to favour margin, not just volume.

Whether service is slipping

Workflow: Open calls, SLA breaches and repeat visits per engineer are on one view, reviewed weekly.

Result: Problems are seen before the hospital escalates them.

Who it is for

Owners and directors who want one screen, not three reports.

👨‍💼
Founder-owners

Running sales, service and money personally.

🏥
Directors of distributors

Several branches, several brands, one P&L.

🤖
Device company founders

Installed base, dealers and territories at a glance.

💰
Finance heads

Ageing, payables, cashflow and GST prep without a spreadsheet.

🛠
Service heads

SLA, repeat calls and contract profitability.

The honest comparison

Spreadsheets, accounting dashboards, or a live operations view.

 
Spreadsheets and WhatsApp
Accounting software
Aura Business
Source of numbers
Typed weekly
Invoices and receipts
Every transaction across sales, service and money
Pipeline
A sheet
Not included
Live by stage with expected close
AMC at risk
Not shown
Not shown
Contracts lapsing with rupee value
Service metrics
None
None
Open calls, SLA breaches, repeat visits
P&L by product and territory
Manual
By ledger, if set up
Built in, including service cost
How it reaches you
Someone sends it
Log in
Dashboard, WhatsApp, notifications, AI assistant
Proof

Platforms we have actually shipped.

Questions

Distributor dashboard and analytics, answered.

What is on the owner dashboard by default?

Pipeline value by stage, collections and outstanding, AMC and CMC revenue at risk in rupees, open service calls with SLA status, and cashflow. Tiles are configured to your priorities during setup, and each drills down to the underlying records.

Can reports be sent to me automatically?

Reports from the reports engine can be delivered through the notifications hub and WhatsApp Business integration. The exact schedule and recipients are set up for your business during scoping, so confirm what you need on the call.

How is P&L by product line calculated?

Revenue from invoices is grouped by product line or territory and set against cost of goods from purchases and the cost of service closed against contracts, so a brand's true margin includes what it costs you to support it. See medical equipment management software.

What does receivables ageing show?

Outstanding invoices by customer in age buckets, with the contact and the last reminder sent, so collections calls go to the oldest and largest first. Payment reminders can go out on WhatsApp from the payment tracker.

What service analytics are included?

Open and closed calls by period, response and resolution against SLA, breaches, repeat calls per asset, spares consumed per job, contract profitability and CSAT collected on ticket close. See service management software.

Can I ask questions instead of building reports?

Yes. The AI assistant in the Analytics suite answers plain-language questions over your own data, such as which customers are past ninety days or which contracts lapse next month, and points to the records behind the answer.
Keep exploring

Related Aura Business software

Let's talk about your requirement.

Tell us how you work today. We will show you what the platform would look like for you, and give you a clear scope and timeline.

Founder-led · Chennai, India · Built and supported by the person who wrote it