← Elevate Aura  ·  HIMS & AuraPACS clinical software Chennai, India · WhatsApp
For owners and administrators

A hospital MIS dashboard built from today's entries, not last month's returns.

HIMS shows OP and IP volume, bed occupancy and collections live on one screen, because the numbers come from the registrations, admissions and bills the hospital is already making. Reports break the same figures down by department.

OP, IP, beds and collections liveReports by departmentNo monthly compilation exercise
his.elevateaura.co.in/dashboard
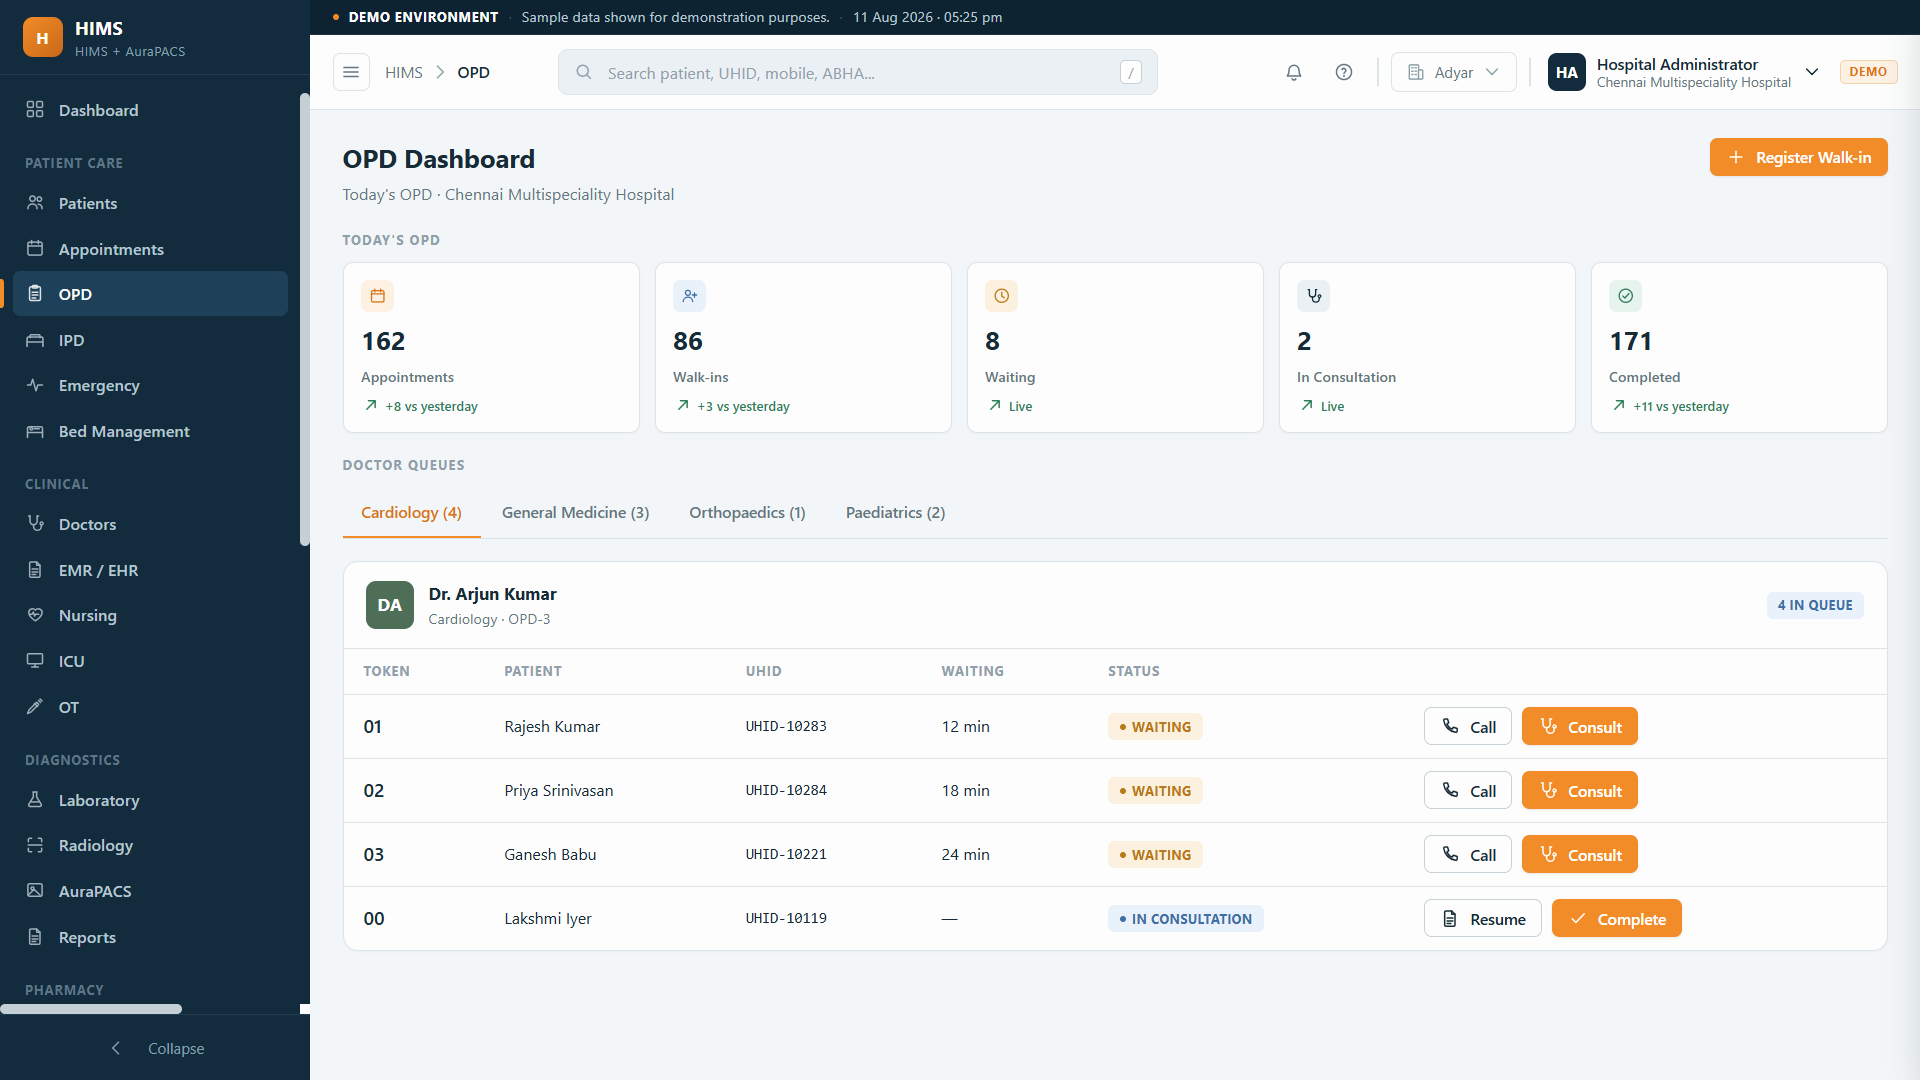
HIMS dashboard showing OP and IP counts, bed occupancy and collections for the day
In one sentence

What the MIS dashboard in HIMS shows

A hospital MIS dashboard is the management view of what the hospital did today: how many patients registered in OP, how many are admitted, how many beds are occupied ward by ward, and what has been collected. In HIMS that screen is not compiled by anybody. It reads the same registrations, admissions and bills the front desk and the billing counter have been creating since morning, so the figure on the screen and the figure in the register are the same figure.

Underneath the live view sit reports. The same numbers are broken down by department, by doctor, by payer and by period, so a conversation about why OP was thin last week can be had against data rather than impressions. Because billing, pharmacy, laboratory and the wards all write to one record, the departmental split does not require anyone to tag entries afterwards.

It also changes who can answer a question. When the figures are on a screen rather than in one person's ledger, a department head, an administrator and the owner are all arguing from the same number, and the argument moves on to what to do about it.
Why MIS usually arrives late

Most hospital numbers are assembled, not observed.

By the time the report reaches the owner, the month it describes is over.

Registers added up by hand

OP counts, admissions and collections are totalled from separate books at month end by whoever is free.

Numbers that do not agree

The billing total, the pharmacy total and the front desk count come from three sources and never tally.

Occupancy known only to the ward

The administrator asks the nursing station how many beds are free and gets an answer that is already out of date.

No departmental split

There is a hospital total but nothing that says which department produced it.

Outstanding invisible

Cash collected is known. What is still sitting with TPAs and corporate panels is not.

How a number gets on the screen

Nobody types the dashboard.

01

The front desk registers

Each OP registration and appointment counts itself.

→
02

The ward admits

Admission, bed allocation and discharge move the occupancy figure.

→
03

Departments deliver

Pharmacy issues, lab results and theatre cases post against the patient.

→
04

Billing collects

Receipts and payer split land on the collections figure as they are taken.

→
05

The dashboard reads

The screen aggregates what is already recorded, for today or any period.

→
06

Reports break it down

The same figures are filtered by department, doctor, payer and date.

What you can see

The live view and the reports behind it.

📊Live figures

  • OP registrations today
  • IP admissions and discharges
  • Bed occupancy by ward
  • Collections as they are taken

📋By department

  • OP volume per department and doctor
  • Pharmacy and laboratory activity
  • Theatre cases
  • Emergency and casualty load

₹Money

  • Payer mix across cash, insurance and TPA
  • Outstanding per payer
  • Package and credit billing totals
  • Receipts and refunds

🔒Trust in the number

  • Drawn from the source entry, not a re-entry
  • Role-based access to what each person may see
  • Audit trail behind the figures
  • Same data the departments are using

See the full hospital management system →

In practice

Four questions the dashboard answers in seconds.

How did today go?

Workflow: The owner opens the dashboard in the evening and reads OP, IP, occupancy and collections for the day.

Result: The question is answered without a phone call.

Which department is carrying the month?

Workflow: OP volume and billing are filtered by department and doctor across the period.

Result: Rosters and clinic hours get decided on evidence.

Are the beds working?

Workflow: Ward occupancy is read alongside admissions and discharges for the week.

Result: Slow-turning wards become visible.

What is still owed to us?

Workflow: Outstanding is shown per payer, including TPAs and corporate panels.

Result: Follow-up is aimed at the right organisation.

Who it is for

The people asked to explain the month.

💼
Hospital owners

One screen instead of four phone calls.

📊
Administrators

Occupancy, volume and collections daily.

₹
Accounts teams

Collections and outstanding by payer.

🏥
Multi-specialty hospitals

Departmental performance without manual tagging.

📋
Quality coordinators

Activity figures that come from the record.

The honest comparison

Where management numbers come from.

 
Paper registers and Excel
Enterprise hospital ERP
HIMS by Elevate Aura
When the number arrives
Month end
Overnight batch, usually
As the entry is made
Who compiles it
A staff member
A reporting team
Nobody
Departmental split
Manual tagging
Configured cost centres
Comes from the record itself
Occupancy
Asked from the ward
A separate module
Live from bed management
Time to have it running
Already running badly
A long implementation
Live in 30 working days where scope allows
Questions

The hospital MIS dashboard, answered.

Is the dashboard live or does it run overnight?

It is live. The figures read the registrations, admissions, dispensing, lab orders and bills as they are recorded, so what the screen shows in the afternoon reflects the morning that just happened.

Can we get reports by department and doctor?

Yes. Because every entry already carries the department, the doctor and the patient, the reports filter the same data rather than asking anyone to tag it afterwards. Periods are selectable.

Does it show money owed by TPAs?

Yes. Outstanding is shown per payer, so cashless claims sitting with a TPA are visible next to cash collections. The claim detail lives in TPA and insurance billing.

Can we control who sees the numbers?

Access is role based. A department head, an administrator and the owner see what their role allows, which is how collections and payer detail stay with the people who should have them.

Do we need a separate reporting tool?

No. The dashboard and the reports are part of HIMS and read the same database the hospital works in, so there is nothing to export, load or reconcile between two systems.

How is this different from a hospital ERP?

An ERP is a way of describing the whole operations layer. The dashboard is the management view on top of it. If you are weighing the two labels, read HIMS vs hospital ERP.

Keep exploring

Related HIMS pages

Let's talk about your requirement.

Tell us how you work today. We will show you what the platform would look like for you, and give you a clear scope and timeline.

Founder-led · Chennai, India · Built and supported by the person who wrote it